VARIANCE
Variance of returns is widely used as a measure of a financial asset’s risk. Practitioners and academicians have been using variance or standard deviation of returns as a measure of a stock’s risk for the last 60 years or more. However it has long been known that variance is not the best measure of risk.
Semi-variance, which measures the dispersion of losses, is a better measure of risk. Even Harry Markowitz who pioneered modern portfolio management and the use of variance considered semi-variance to be a better measure of risk; he said so in his book “Portfolio Selection – Efficient Diversification of Investments.” But he decided to use variance because of computational difficulties in using semivariance in portfolio management.
Variance is a measure of the volatility of returns. However, when we think of risk we are mostly concerned about losses and not about the general volatility of returns. Volatility on the loss side is undesirable while volatility on the profit side is desirable i.e. only part of volatility is risk. Investors are not volatility averse; in particular they are not averse to volatility caused by higher returns.
Investors in stocks seek maximum profits; not uniform profits. Higher profits are highly desirable therefore they, or any of their consequences, should never form part of risk. But in the variance based system the risk of an asset increases when it earns high returns.
About half of the data points included in variance are not elements of risk. Variance is therefore not really a measure of risk. But it is used because it is mathematically elegant and easy to use. The following folktale helps make the point.
Mulla Nasruddin was searching for something under a lamp-post in his garden. When his neighbor asked him what he was searching, he replied that he was looking for his house key.
Wanting to help him, his neighbor joined him asking: ”Do you remember where you dropped it?”
Mulla Nasrudin answered: ‘Of course I do, in my house.’
‘Why are you looking here?’ asked his neighbor confused.
Mulla replied: ‘Because there is much more light here than in my house.’
Variance is counter intuitive and an unreliable measure of risk
Some changes in risk as measured by variance are strikingly counter intuitive e.g. risk measure increasing with increasing positive returns, or risk measure decreasing or remaining unchanged with increasing frequency of negative returns. Investors therefore tend to ignore risk valuation when their intuition does not agree with it. Dependability, a major strength of a numerical measure, is lacking in variance.
The unreliability of the variance based risk measure has led to the development of a business in implied volatility e.g. VIX. Implied volatility is the valuation of risk that buyers and sellers implicitly agree on when they trade options; it is generally a subjective valuation of risk. VIX is the implied volatility in prices of options on S&P500.
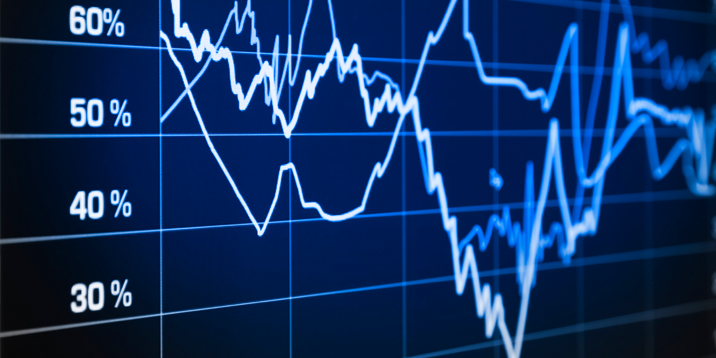
The flawed nature and counter intuitiveness of variance is further illustrated by comparing VIX with S&P500. As the following chart shows S&P and VIX move in opposite directions i.e. when S&P is rising VIX is falling and vice versa. This behavior of VIX is intuitively appealing because we expect risk to go down when the asset is performing well. In contrast, variance tends to rise when S&P rises.

VIX shows how an asset’s risk really behaves with respect to its performance and that markets actually lower their assessment of risk in response to higher returns. Currently that assessment process is mostly subjective because of the shortcomings of variance.
Variance is a false measure of risk. No wonder professional quantitative portfolio managers have such a difficult time beating dart throwing monkeys.
SEMI-VARIANCE
In finance the possibility along with the severity of loss is called risk. Risk is a concern about losses; therefore a measure of risk should quantify losses. Semivariance quantifies losses; it measures the dispersion of losses; it is a true measure of risk.
A good measure of risk, if assessed from historical data, should go up for bad results and go down for good results. Risk as measured by semi-variance increases with higher losses and decreases with lower or no losses.
Losses are of many types. Some investors may see profits that are below the risk free rate as loss, they can use risk free rate as the dividing line or the cutoff point for calculating semi-variance; any return below the cutoff point will be considered negative return or loss. Similarly, investors may also use zero return, current return, mean return, expected return or any other measure of return as their cutoff point.
Old (Markowitz) Semi-variance method
Variance of a portfolio is formulaically computed by using variance of individual assets and their co-variances with other assets. As assets or their weights change in a portfolio, the variance of the portfolio is easily recalculated by using the same asset variance – covariance formula. The case with portfolio semivariance (old) is very different.
Portfolio semivariance is based on portfolio returns of those years the portfolio made a loss. Asset semivariances and semi-covariances, specific to the portfolio, are also calculated from the asset return data of the years the portfolio made a loss. In other words, all asset and portfolio semivariances have to be computed using only the return data for the years that the portfolio made a loss.
Since asset semivariance and semi-covariance are not constants but a variable dependent on the portfolio, there is no point in going through the additional step of computing them for use in portfolio semivariance calculations. It is much efficient to compute portfolio semivariance (old) directly from the portfolio loss years’ return data. Portfolio optimization is also done using portfolio loss data.
Failings of the old Semi-variance method
The major failing of the old semivariance method is in portfolio optimization. Since portfolios are optimized using only portfolio loss data the optimization process becomes detached from the assets and doesn’t benefit from reading all of the asset loss data and the trends hidden in them. Some asset loss years are not in portfolio loss years.
The quality of the data on which optimization is based is further compromised by the mixing of positive returns with negative returns; some asset profit years are in portfolio loss years.
Portfolio optimization done with old semivariance is based on a set of data that does not have all the asset loss data and is also a mixture of loss and profits at the asset level. Assets are the fundamental or basic units of risk. A system that does not read assets correctly cannot create an efficient portfolio. Therefore old semivariance optimum portfolios don’t perform well as investments.
THE PULSE METHOD
In old semivariance, asset semivariances and semi-covariances are portfolio specific and cannot be used to compute semivariance of other portfolios.
Pulse method overcomes the problem of portfolio specific asset semivariances and semi-covariances by computing a closely tracking proxy of portfolio semivariance (old).
Pulse asset semivariances and semi-covariances are computed only from asset return data i.e. independently of portfolio data. Pulse asset semivariances and semi-covariances are not portfolio specific; they are independent of the portfolio; they can be used to compute semivariance of any portfolio.
Pulse measures risk by reading asset data completely and correctly. Assets are the fundamental units of risk. Pulse portfolios perform better because Pulse constructs an optimum portfolio by measuring assets’ risks and then combining them in a manner that minimizes overall portfolio risk.
The Pulse method is also superior to many other portfolio optimization models that were proposed to replace variance e.g. those using Lower partial moments (LPM) and/or ARCH/GARCH analysis. The Pulse method is simple, parsimonious and effective.
Pulse method has a clear mathematical formula which can be used, like variance, in computing portfolio semivariance and in portfolio management. Making asset semivariances and semi-covariances constants (independent) is one of the main achievements of the Pulse method.
Pulse method’s advantages over old semivariance
In old semivariance, portfolios are optimized by reading only portfolio loss data; the optimization process does not read all of the asset loss data to be able to read their underlying trends. The quality of the data on which optimization is based is further compromised at the asset level by the mixing of positive returns with negative returns which happens because some assets have profits in portfolio loss years. Portfolios that are optimized using old semivariance are not based on a correct measurement of asset risk.
Furthermore, in the old semivariance method the data keeps changing in response to changes in the variable being optimized i.e. the weights of assets. The optimization process is thus compromised because it is dealing with a different set of data every time it tries a new iteration; a new iteration in portfolio optimization is a new set of asset weights. Portfolios created by old semivariance based optimization can have an optimal risk-return tradeoff only by chance.
In contrast, the Pulse method by using the entire asset loss data benefits from reading the underlying trends in asset risk. Additionally, by using the same set of data and the same asset semivariances and semi-covariances, irrespective of the weights of assets, the Pulse portfolio optimization process has the data continuity necessary to work out an optimal risk return tradeoff; it therefore produces best performing portfolios.
The main achievement of the invention – the Pulse method – is not only that it makes it easier to use semivariance in portfolio optimization but also that the optimal portfolios created by this method are resilient over time and therefore are good investments. Evidence of their resilience for a year is provided in the section on backtest results and in the attached spreadsheet.
Pulse method’s advantages over variance
A major adverse consequence of the use of variance is that investors’ risk averseness gets translated into their being volatility averse. A volatility-averse investment program or portfolio has diminished chances of achieving high return. In the words of Harry Markowitz “Analyses based on semivariance tend to produce better portfolios than those based on variance. Variance considers extremely high and extremely low returns equally undesirable. An analysis based on variance seeks to eliminate both extremes. An analysis based on semivariance, on the other hand, concentrates on reducing losses.”
In other words, variance based (volatility-averse) optimization will reduce potential returns. Harry Markowitz confirms this in the following statement about variance optimized portfolios “The only complaint one can raise about such a portfolio is that it sacrifices too much expected return in eliminating both extremes.”
On the other hand, a semivariance based (volatility-of-loss-averse) investment program or portfolio will only avoid the extremes on the loss side; it will not diminish chances of achieving high return.
Semivariance diversifies away risks. Variance diversifies away both risks and opportunities.
Backtests for the Pulse method – Results and methodology
Performance of the Pulse method has been assessed by running hundreds of back-tests. In each backtest optimum portfolios are constructed using the Pulse method, the variance method and the Markowitz method; a random portfolio is also created.
Optimum portfolios are constructed by maximizing Risk adjusted return or Sharpe ratio. Risk adjusted return = (Expected Return – Risk free rate)/ risk. Expected Return is simply the average return over the period. Risk free rate is assumed to be zero. Risk is semi-deviation (square root of semivariance) or standard deviation of returns. Returns below the mean are considered losses for semivariance calculation purposes i.e. mean is the cutoff point.
Stock returns (total returns including dividends) data of 30 stocks for 38 years (1975 to 2012) is used for the series of backtest discussed here. Each backtest is for a portfolio of 8 stocks; there are millions of 8-stock combinations in a population of 30 stocks.
Each optimization run uses 20 year data. The first 20 year history is used for the first loop of the test run i.e. data from 1975 – 1994 is used to construct the first of a series of optimum portfolios. The second run is for 1976-1995 period. This process is repeated 18 times to reach 2011 returns i.e. every backtest has 18 optimal portfolios for each method.
An investment in each of the portfolios thus created is supposedly made for one year and performance evaluated. For instance, the performance of the portfolio constructed using 1975-1994 data are evaluated using 1995 returns of the stocks; similarly for the loop ending in 2011 performances are evaluated using 2012 returns.
The performances of the Pulse portfolio, the variance based portfolio, the Markowitz portfolio, and the random portfolio are compared. Pulse portfolios outperform all other portfolios in almost all the tests. This result is consistent over the range of assets and times tested. Pulse portfolios outperformed Variance portfolios by margins that were generally higher than 25%.
Pulse optimized portfolios outperformed variance optimized portfolios 14 times out of 18 in the results attached. Over an 18 year period Pulse portfolios earned a return of 258% whereas variance optimized portfolios earned a return of 186% (no compounding assumed). Pulse portfolios outperformed random portfolios and portfolios optimized using old (Harry Markowitz’s) semivariance method by even greater margins.
Matlab’s fmincon is the application used for optimization. A spreadsheet summarizing the results of a simple backtest is attached.
INVESTMENT ACTIVITIES THAT WILL BENEFIT FROM THE INVENTION
Achieving the potentials of quantitative portfolio management
Since variance does not measure risk correctly its use has kept quantitative portfolio management from achieving its potentials.
Risks and returns are the two main variables in asset selection. Since semivariance is a better measure of risk than variance, its use should therefore result in better portfolio optimization. A change in the risk measure from variance to semi-variance will enable quantitative portfolio management to achieve its potentials.
Asset Pricing
Asset pricing models such as the Capital Asset Pricing Model (CAPM) and the Black-Scholes Option pricing model use risk in pricing assets. Use of semivariance instead of variance will significantly improve their performance as asset pricing models. For example, the volatility measure used in options prices will start to have an objective basis; implied volatility and measured volatility will converge.
CAPM will be better able to explain most capital asset prices. Prices suggested by the model would become relatively dependable. Beta will be clearly observable in capital asset price behaviors and consequently will be commonly used and have better intuitive appeal.
Author: Syed GhulamQadir Rye
December 2013.
The following is an example of the results achieved in hundreds of back-tests conducted to test the performance of the Pulse method. The results are annual returns in decimal fractions.